As marketers, you know how valuable data is to every function of your campaign.
From sending emails to optimizing landing pages, you need a full suite of analytics to help you make strategic decisions.
While marketing trends may come and go, it’s inarguable that data analytics are here to stay.
As our tools get smarter, we can unearth new information about user behavior. This information can then drive how we optimize campaigns and adjust existing strategies to be reactive to, or ideally proactive around, that user behavior.
As we all migrate toward being more data-driven marketers, one of the most useful metrics that can help you in nearly every aspect of your marketing campaign is statistical significance.
Never heard of it? Historically, this metric has been used to predict the plausibility of a certain hypothesis. While this term may not be immediately aligned with your marketing practice, it is actually incredibly useful.
If you’re not using this metric, now is the time to start.
In this blog post, I break down what statistical significance is, how it can help your campaigns, and how to start calculating it.
What Is Statistical Significance?
Whether you’re new to testing your marketing campaign performance or have been tracking metrics for decades, you should add statistical significance to your to-test list.
Statistical significance refers to the likelihood that a test outcome did not occur by random chance, but was influenced by an outside source.
While this may seem like a down-in-the-weeds statistics term, assessing the likelihood of statistical significance on different aspects of your campaigns, like your blog, can actually provide results that can change the way you run, optimize, and execute future campaigns.
Why Is Statistical Significance Important in Marketing?
For marketers, statistical significance doesn’t just shed light on one aspect of your campaign.
It allows you to view your efficacy through a number of lenses.
By using this method, you can turn your projections into near absolutes, allowing you to have a better understanding and projection of what the outcomes will be.
This metric can be used to project success of landing page changes, the efficacy of call to action phrasing, subject line optimization success, and many other variables.
A/B Testing
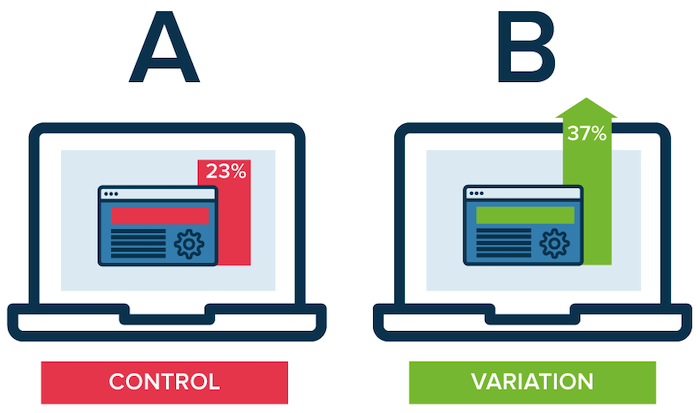
As a marketer, you know the value of A/B testing and have most likely used this technique throughout your digital strategy. When you apply statistical significance to these data sets, you can determine if an A/B test was successful or unsuccessful. In an ideal world, A/B tests reach 90 percent statistical significance, indicating that the projected change will either positively or negatively impact the environment you’re adjusting.

If you’re testing site performance, the best way to reach statistical significance is to test pages with high traffic or conversion rates, with test times falling within two to eight weeks.
Application of Marketing Budget
While statistical significance can help you determine outcomes within campaigns, it can also help you assess where your marketing budget will be best spent. Through determining the statistical significance of outcomes, you can optimize your budget, spending on areas you can define as underperforming, and diverting funds from areas where extra budget is not needed.
Through this lens, you can save more and spend smarter, and be confident in your projected outcomes.
Improved Hypotheses
If you’re testing any two (or more) variables against one another, you inevitably have a hypothesis. When you use statistical significance to test your variables, you can prove or disprove that hypothesis through in-depth data analysis. Through statistical significance, you can use actionable data to prove (or disprove) your original hypothesis.
How to Calculate Statistical Significance
Now that we’ve unpacked what statistical significance can mean for your marketing efforts, it’s time to talk about calculation.
While we offer this handy tool, you should also understand the how behind the calculation of statistical significance.
1. Establish Test Subject
Whether you want to compare conversion rates on landing pages with different banners, clickthrough rates (CTRs) on emails with varying subject lines, or the success of different call-to-action buttons, pick the set of items you want to test.
2. State Your Hypothesis
We talked earlier about how statistical significance can help strengthen your hypotheses: and it’s true. It’s also true that you should always have a hypothesis at the beginning of your test to assess the degree of confidence.
3. Collect Your Data
Regardless of what you’re testing, you need to determine your sample size. If you’re testing a landing page, that may be the duration of time that your page is live. If you’re testing an email, you can choose a random sample of your audience to send variations of your email to.
4. Assess Chi-Squared Results
While there is a slew of statistical tests you can use to measure significance, more often than not, you’ll use the Chi-Squared method.
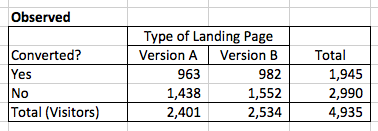
After collecting the data, enter it into a chart for easy organization. If you’re testing two variables with two potential outcomes, you can create a 2×2 chart that allows you to easily view your results.

5. Determine Your Expected Values
To successfully assess what to expect from each iteration of the landing page, multiply the row total by the column total and divide it by the number of actions (visitors, etc.)
6. Revisit Your Hypothesis
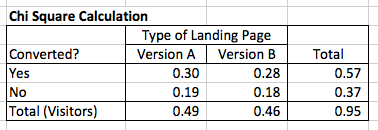
After you’ve gathered all your data, it’s time to revisit your hypothesis and see if what you anticipated turned out to be true. To guarantee you have the best visibility into the difference between projection and outcome, square the difference by using the equation: (expected – observed)^2)/expected.

7. Find Your Sum
To find our Chi-Square number, sum the results. In the table above, the sum is .95. To determine if the results are different with statistical significance, compare this with a Chi-Square.
In the above example, the Chi-Square value must be equal to or exceed 3.84 for the results to be statistically significant.
Given that .95 is less than 3.84, the results in the above table are not statistically significant, indicating that there is no correlation between different versions and the actions users take.
This method gives marketers certainty about outcomes, providing better visibility into individual optimizations.
How to Avoid Inconclusive Results
If your statistical significance tests keep coming up as inconclusive, there are some steps you can take to gain better insights from these tests.
Segment Your Data
If you’ve encountered an inconclusive test, assess performance across segments, like devices and traffic sources.
By segmenting data, you can gain a clearer view of what is actually working within specific segments, rather than aggregating as a single entity.
Take Your Hypothesis to the Extreme
Testing small changes continuously can burn time and budget. If you’re truly looking to see dynamic results, try bold changes that can drastically impact user behavior.
By taking your hypothesis to the extreme, you can actually achieve your engagement goals, changing the outcome of your campaign.
Reassess Your Hypothesis
If your results are continuously coming back as inconclusive, it may be time to return to the drawing board on your hypothesis.
Ask yourself the following questions to determine if your hypothesis needs fine-tuning.
- Is your hypothesis backed by behavioral insight?
- Do users care about the changes you are making?
- Are your proposed changes too subtle?
Frequently Asked Questions About Statistical Significance in Marketing
What is statistical significance?
While the term statistical significance may seem complex, it’s really not. Statistical significance refers to the likelihood that a test outcome did not occur by random chance, but was influenced by an outside source.
Why should marketers care about statistical significance?
While this particular test may be perceived as unnecessary when compared to other marketing metrics, conducting a statistical significance analysis allows marketers to prove their hypotheses, conduct smarter A/B testing, better allocate budget, and more.
Can I conduct my own statistical significance test?
You sure can. While you can conduct your own statistical significance test through a seven-step process outlined in this blog, you can also use our handy tool to calculate significance.
What is a good outcome for a statistical significance test?
If your test comes back at 90 percent or above, you can be confident that your results are statistically significant.
Statistical Significance in Marketing Conclusion
While it is important to remember that significance doesn’t equate to validity, by assessing statistical significance, you gain much clearer visibility into your digital marketing hypotheses.
As you begin to use this method to determine if your call to action (CTA) button needs a refresh or your email subject line needs a refresh, your confidence, and comfort with the process will grow.
By incorporating this method into your digital marketing technique, you will also be able to take a more data-backed stance about your hypothesis regarding specific aspects of your campaigns.
What was your most effective use of statistical significance in marketing?


