
From sales targets to conversion rates, chances are you track a range of valuable analytics data. After all, this data allows you to create a winning marketing strategy and grow your business.
The problem? It’s not always easy to make sense of the data, especially if it’s held across a bunch of different files on your hard drive.
Wouldn’t it be great if you could bring these data sources together and view, at a glance, exactly how your marketing strategies are performing? If you could visualize your data and share your findings with key team members?
Well, I’ve got great news for you. Power BI (short for business intelligence), a Microsoft tool, makes all of this (and more!) possible.
Let me introduce you to what’s awesome about Power BI and give you some ideas for how to use it as part of a wider marketing strategy.
What Is Power BI?
Think of Power BI as a connectivity tool. The interface allows you to bring unconnected sources together, like data from spreadsheets or online services, and turn them into rich, interactive reports.
With Microsoft’s Power BI, you can visualize your marketing data and gain insights you might not access otherwise. Visual reports may help give you a better sense of what’s working across your organization:
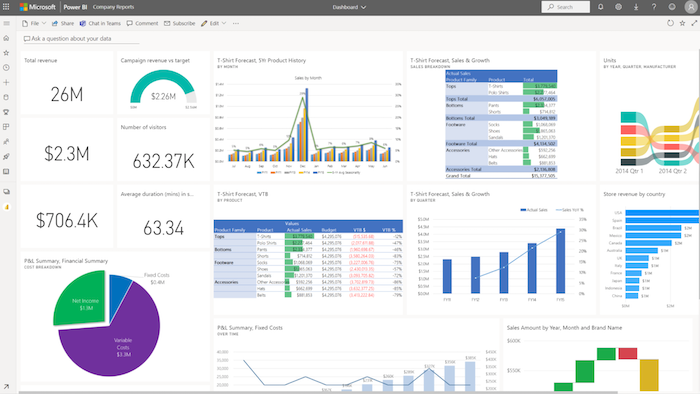
Whether you need a report for a presentation or a new marketing strategy, Power BI can help.
There are three parts to Power BI:
- Power BI Desktop: Power BI Desktop is an application for creating and exporting reports.
- Power BI service: With the Power BI cloud service, you can view reports created in the Power BI Desktop service and share them across the company.
- Power BI mobile app: The Power BI mobile app is a portable tool for monitoring reports and acting on real-time data.
There are also free different subscription levels, depending on your needs:
- Power BI Free: With Power BI Free, you can access the Power BI Desktop app to create and manage reports.
- Power BI Pro: Starting at $9.99 per user per month, Power BI Pro gives you access to the cloud-based service.
- Power BI Premium: This powerful, enterprise-level analytics tool starts at $20 per user per month.
You can use the Power BI Desktop app on the free tier, but you can’t use the cloud-based service without a paid subscription. This means you can generate reports in the free app, but you can’t share them on the cloud.
If you’re unsure whether a Pro or Premium subscription meets your needs, you can sign up for a free Power BI Pro trial.
Getting Started With Power BI for Marketing
Microsoft has made Power BI as straightforward as possible, but let’s walk through some of the key steps for getting started.
Choose Pricing Structure
First, decide which plan you want. As mentioned, you can sign up for the free plan, which uses the Power BI Desktop app, a free Pro or Premium trial, or a paid monthly subscription.
To find out more about the tiers, check out the pricing page.
Open an Account
Next, you need a Power BI account.
Click “Try free” or “Buy now” on the pricing page, depending on which plan you choose. Then, follow the onscreen instructions to create your Power BI account:
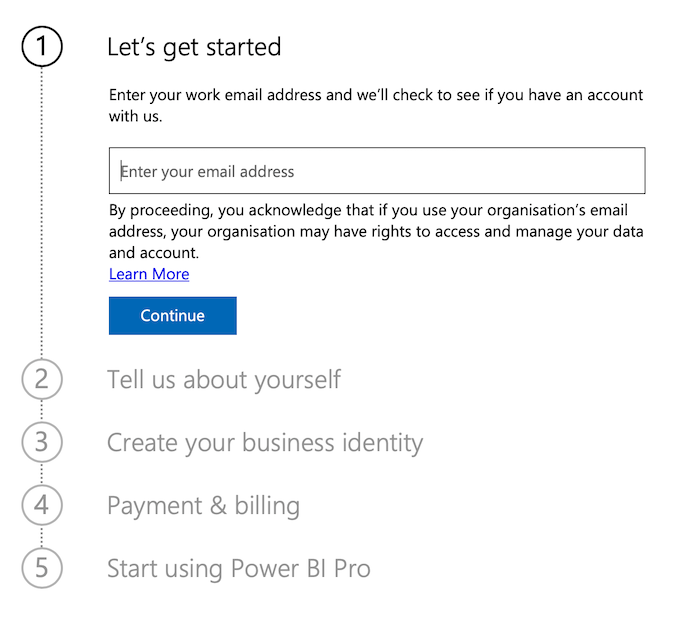
Once you’re set up, you can start using the Power BI suite.
Download and Install Power BI Desktop
Then, download and install the Power BI Desktop app.
Many marketers use Power BI Desktop to import datasets, create reports, and then switch to the cloud-based Power BI service to share their findings and collaborate.
However, you might only need Power BI Desktop if you work alone or share data very occasionally.
With that in mind, here’s how to get Power BI Desktop.
- Go to the “Power BI Desktop” page.
- Click the “Download free” button.
- Follow the instructions to install the program on your device.
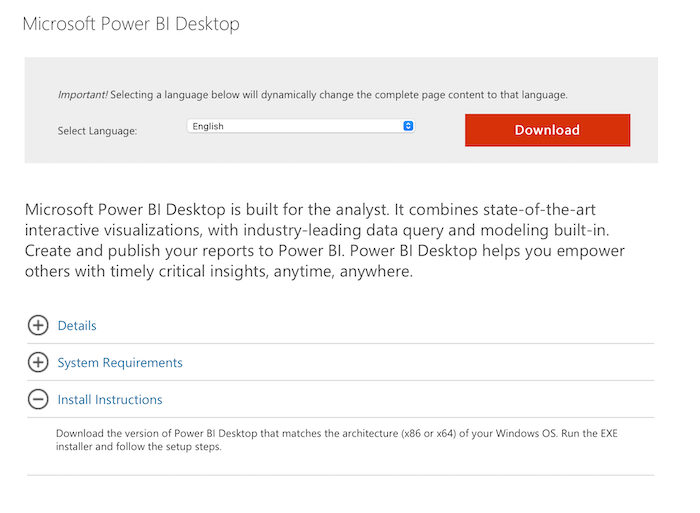
If you’re going for a paid tier, you can then sign up for the cloud-based Power BI service.
Import Your Data
To get started with Power BI Desktop, you need to import data. You can import data from multiple sources, including the web, Excel spreadsheets, and existing Power BI datasets.
First, select “Get data” from Power BI’s home ribbon, and pick your data source:
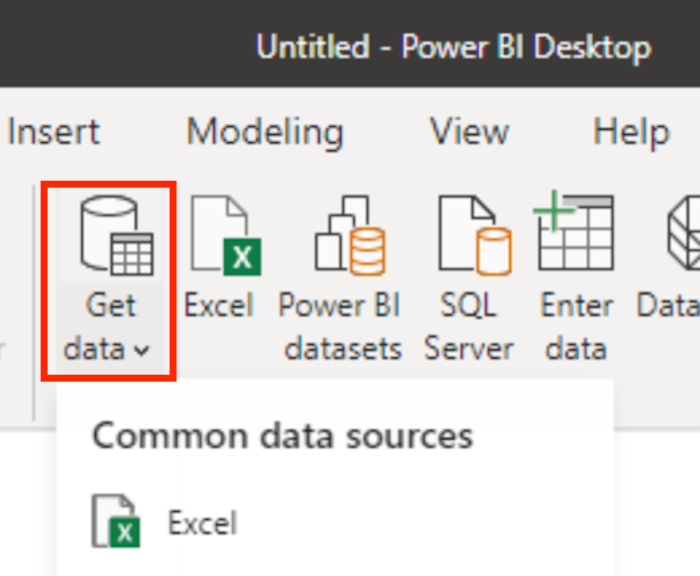
To see all available data sources, click the “More” option at the bottom of the menu.
Next, open the relevant file.
Remember, you’re not restricted to importing just one dataset.
Model Your Core Marketing Data
To create a visual report, you must first create relationships between your data sources. You do this by modeling your data.
Microsoft has a whole tutorial on this, but essentially, “modeling” is how you decide what type of report you want to create.
For example, maybe you want a report showing conversion rates for different paid ads for A/B testing purposes. As long as you have the data, you can make it visually usable with Power BI.
Visualize the Data
Next, choose your visualization. Your visualization is the format for reviewing your report, such as pie chart, bar chart, and so on:
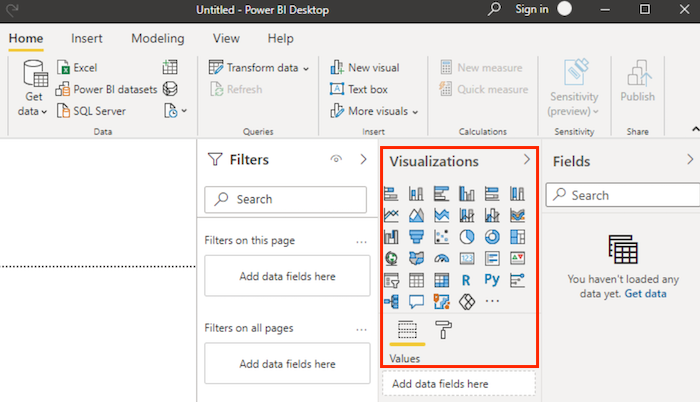
You can also segment the data further by adding custom on-screen filters for your team members to interact with.
Export Your Work
Ready to share your work? If you’re using the Power BI service, simply access your desired report from the workspace and click the “Share” option:

Once shared, your recipients can interact with the report based on whatever permissions you give them.
Want to export a report from the Power BI Desktop app?
One option is to convert it to a PDF. You can then share the report with others or move it over to the Power BI service.
To create a PDF from the Power BI Desktop side menu bar, click on options in the following order:
- file
- export
- export to PDF
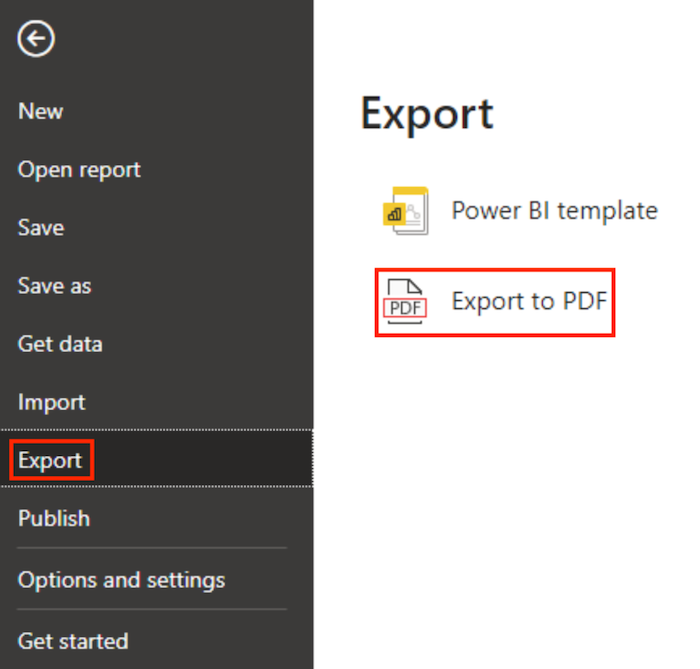
The document then loads onto your standard PDF viewer, and you can share it easily from there.
How to Use Power BI to Improve Your Marketing
OK, so that’s how Power BI works.
How can you use the tool to improve your marketing strategy, though?
While there are many ways you can use the interface, here are four ways you can employ Power BI as a marketing professional.
1. Measure Organic Data
Organic data is hugely important to any marketer because it shows how many people engage with your content and buy your services without clicking on paid ads.
Power BI makes it simple to track organic data. For example, say you want to track your most popular keywords. With Power BI, you can easily import keyword data from a spreadsheet or platform like Google Analytics and analyze the results.
What’s more, you can use the report you generate to impress prospective clients with your SEO knowledge and, in turn, potentially secure new business.
2. Measure Paid Ad Results
Want to measure your paid ad performance?
Simply import your relevant data, such as keyword research, cost-per-click (CPC) analysis, and conversion rates into Power BI. This may help you better understand the strengths and weaknesses of your paid ad campaigns.
You can also create reports combining your paid and organic data. In this sense, Power BI offers you a unique insight into your overall marketing performance by combining highly valuable datasets in a clear, visually appealing way.
3. Analyze and Monitor Your Social Media Marketing Strategy
Is social media integral to your marketing strategy? With Power BI, you can create a dedicated dashboard to help you track key performance metrics, such as:
- audience reach
- number of impressions
- social media mentions
- content shares
- influencer marketing performance
- most popular posts
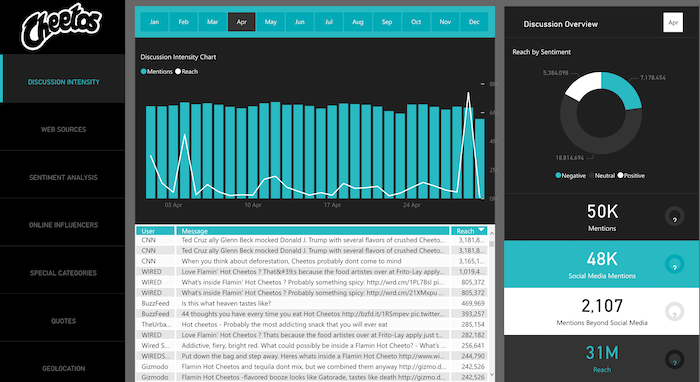
Power BI is a helpful tool for helping marketers visualize their campaigns and monitor social media performance. It’s compatible with platforms like Facebook, Twitter, and Instagram, so it’s flexible enough to handle cross-channel marketing campaigns.
4. Present Marketing Reports
Maybe you want to impress a key client with marketing insights. Or, perhaps you’re meeting with senior management, and they want a detailed performance overview. In any case, Power BI lets you generate clear, engaging, user-friendly reports to share with others.
You could also use Power BI reports to identify trends and growth opportunities in the marketplace or as part of a business startup modeling plan.
Power BI for Marketing: Frequently Asked Questions
What is Power BI?
Microsoft’s Power BI lets you turn datasets into visual analytics reports. You can then visualize critical marketing data and share the results across your organization.
What Are the pros and cons of Power BI for marketers?
Power BI is an affordable, scalable tool for transforming raw data into visual reports. It’s customizable, flexible, and fosters collaboration within your team.
On the other hand, the dashboard may seem crowded. It also takes a fair amount of time to process high volumes of data, and it can take a while to master the interface.
All things considered, though, it’s worth giving it a shot.
How much does Power BI cost?
There’s a free tool for developing reports and viewing them privately. However, if you plan to share reports in the cloud or need an enterprise-level solution, monthly subscription packages are available.
Can I connect Power BI to Facebook?
You can import Facebook data to Power BI. Request a copy of your Facebook page information, download the report, and import your chosen files or datasets into Power BI. The process is similar for Instagram and Twitter data.
Power BI for Marketers: Conclusion
With Power BI, visualizing your core marketing data just got a whole lot easier. You can view everything from sales targets to paid ad performance from a single dashboard, which could help you pivot your marketing efforts to suit your goals and objectives.
What’s more, there’s a subscription to suit every budget, whether you need a free data visualization tool or a scalable enterprise-level solution.
All that said, Power BI is not the only data visualization tool out there, so before you commit to a paid plan, you might want to explore all your options. If you need more help reaching your marketing goals or identifying which metrics to track, you can check out my consulting services.
Have you tried Power BI yet? How’s it working for you?
Did you miss our previous article...
https://consumernewsnetwork.com/technology-news/best-erp-software


